



Real Time Images of the Sun
SOHO EIT 304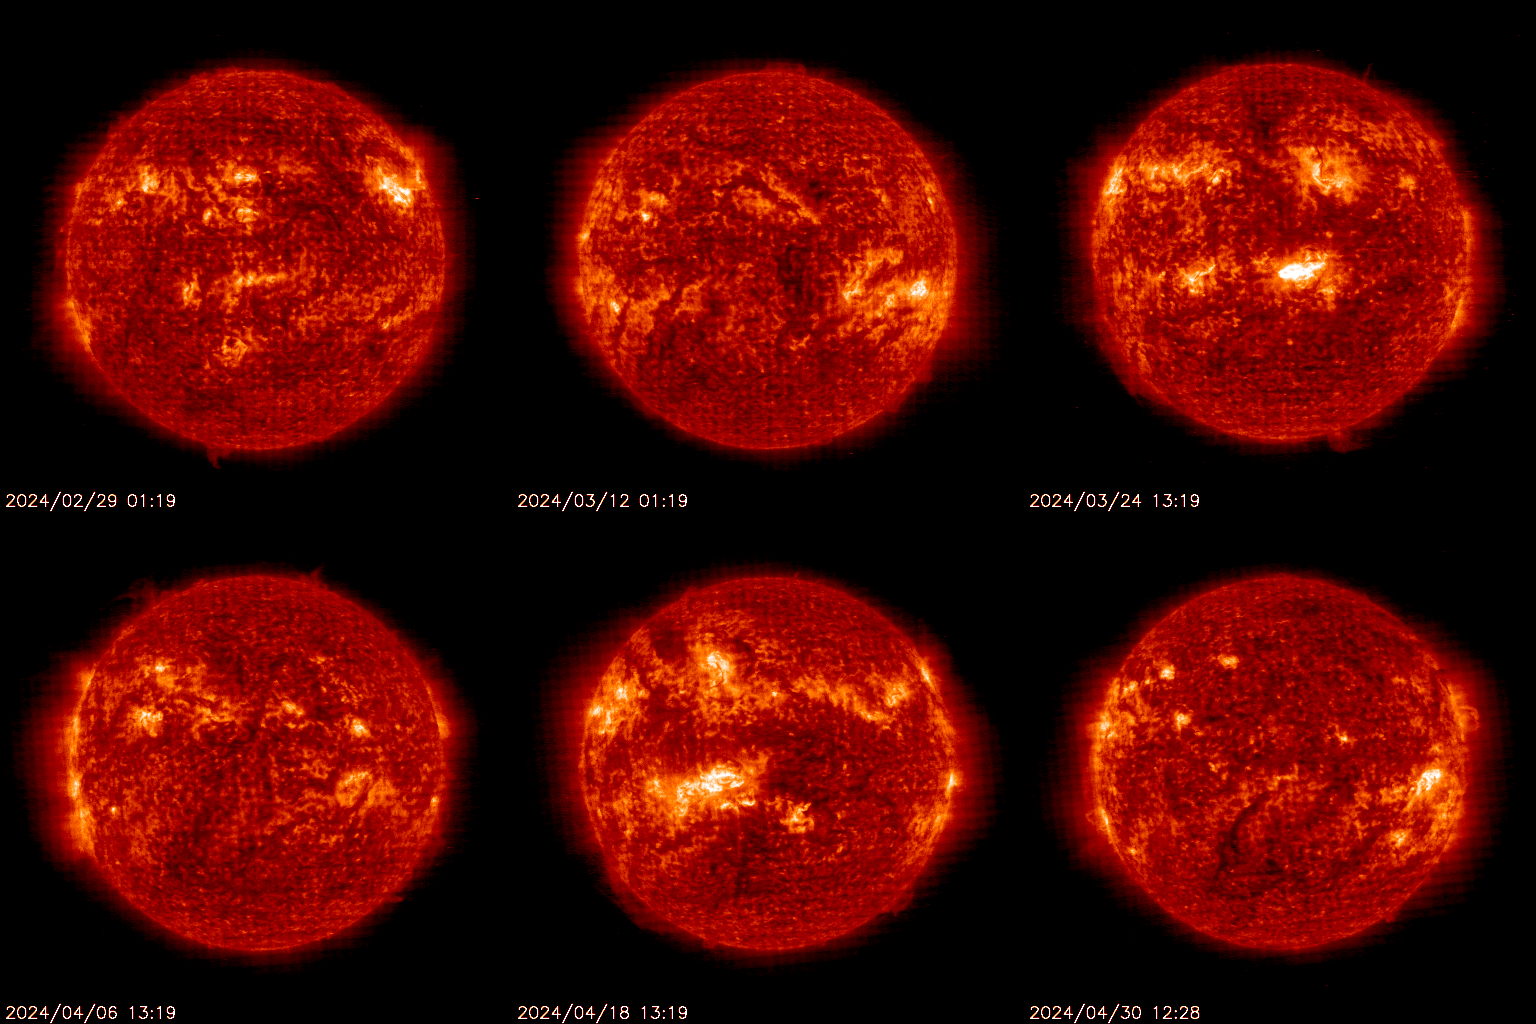
|
SOHO EIT 284 Animated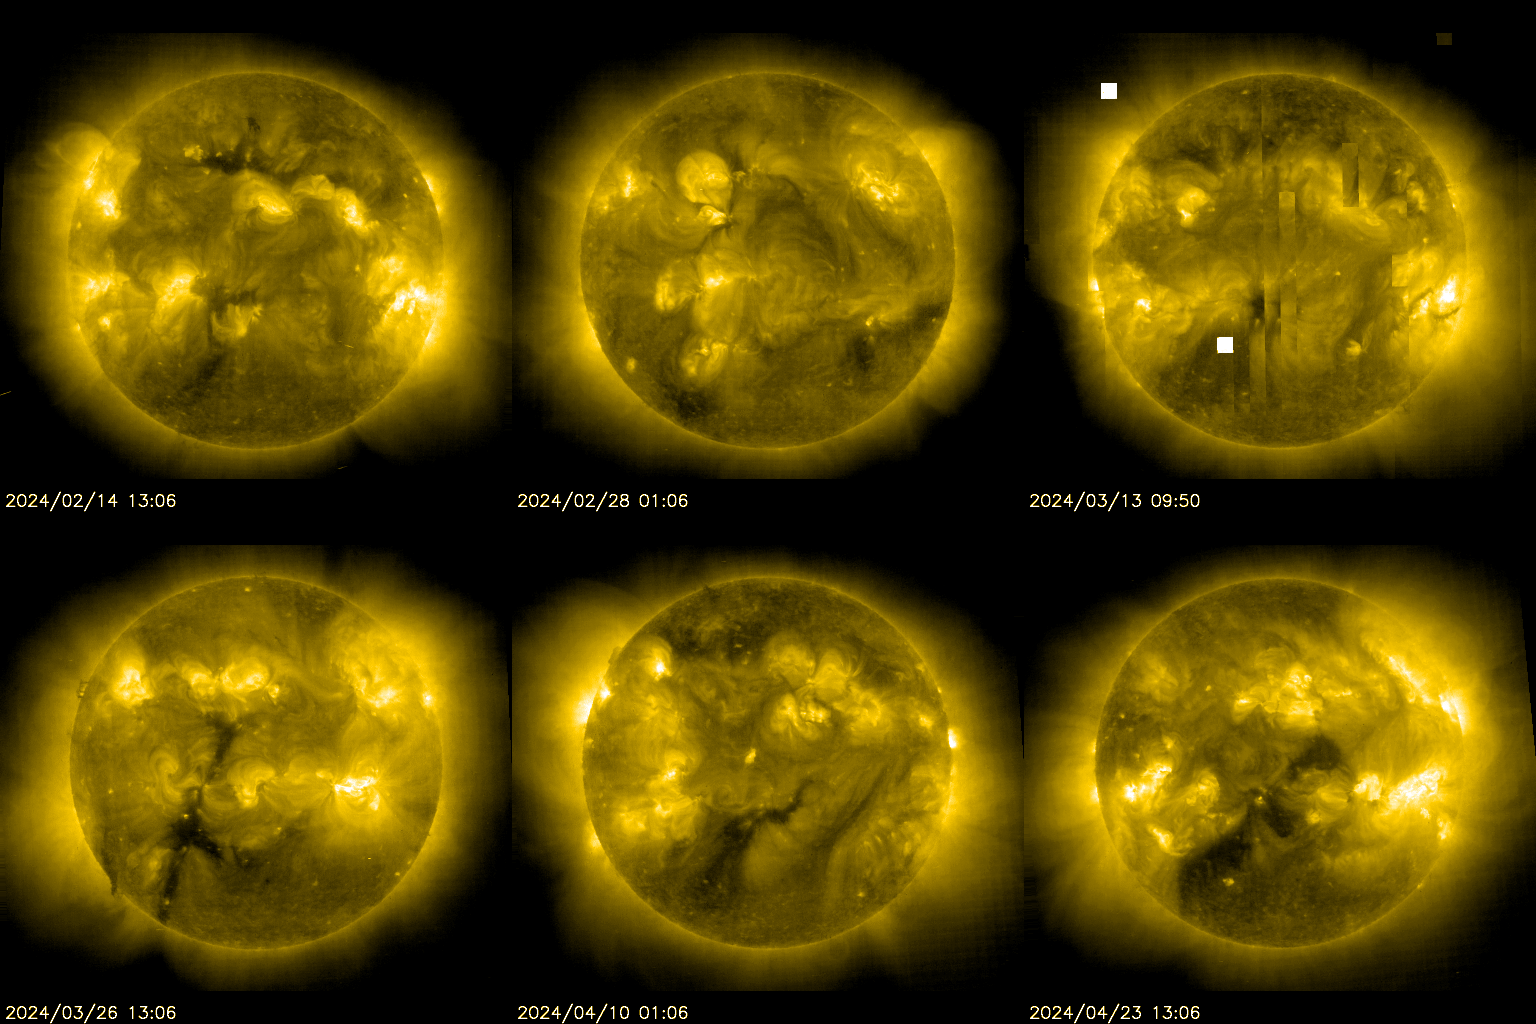
|
LASCO/C2
|
The sun is constantly monitored for sun spots and coronal mass ejections. EIT (Extreme ultraviolet Imaging Telescope) images the solar atmosphere at several wavelengths, and therefore, shows solar material at different temperatures. In the images taken at 304 Angstrom the bright material is at 60,000 to 80,000 degrees Kelvin. In those taken at 171 Angstrom, at 1 million degrees. 195 Angstrom images correspond to about 1.5 million Kelvin, 284 Angstrom to 2 million degrees. The hotter the temperature, the higher you look in the solar atmosphere.
Solar activity continued at low levels with one C-class flare during the reporting period. The largest event of the period was a C1.5 flare at 24/0903 UTC from Region 4536 (N02W40, Dsi, beta). Eight numbered sunspot regions are present on the visible disk. Region 4535 (N12E23, Dso/beta) saw new flux emergence in its trailing spots. Region 4536 continued to grow, consolidating at both magnetic poles. Region 4537 (N07W54, Dao/beta) experienced growth and consolidation, primarily within its trailing portion. Region 4542 (S18E23, Bxo/beta) was numbered during the period. All other regions were stable or in a state of decay. No Earth-directed CMEs were observed.
Solar Activity Forecast
Issued: 2026 Sep 25 0030 UTC
Solar activity is likely to continue at low levels with isolated to occasional C-class flare activity, along with a slight chance for R1-R2 (Minor-Moderate) M-class flare events, through 27 Sep. Energetic
Real Time Solar X-ray and Solar Wind
Solar Cycle Progression
Solar Cycle chart updated using the latest ISES predictions. |
Real-Time Solar Wind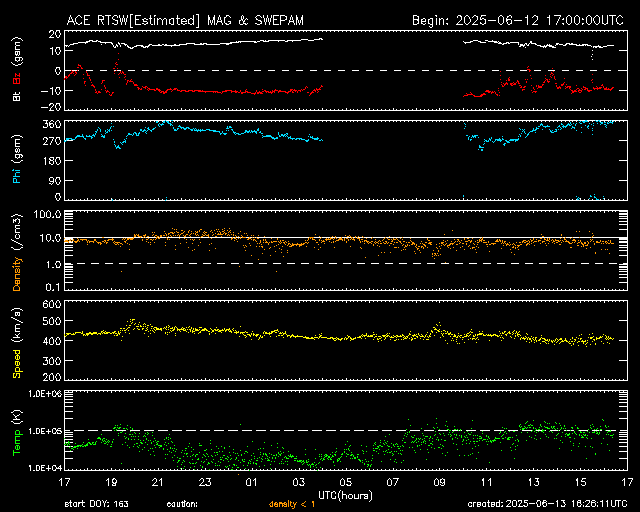
Real-Time Solar Wind data broadcast from NASA's ACE satellite. |
The Solar Cycle is observed by counting the frequency and placement of sunspots visible on the Sun. Solar minimum occurred in December, 2008. Solar maximum is expected to occur in May, 2013.
Solar X-ray Flux This plot shows 3-days of 5-minute solar x-ray flux values measured on the SWPC primary and secondary GOES satellites. |
Satellite Environment Plot The Satellite Environment Plot combines satellite and ground-based data to provide an overview of the current geosynchronous satellite environment. |
Auroral Activity Extrapolated from NOAA POES
Northern Hemi Auroral Map
|
Southern Hemi Auroral Map
|
Instruments on board the NOAA Polar-orbiting Operational Environmental Satellite (POES) continually monitor the power flux carried by the protons and electrons that produce aurora in the atmosphere. SWPC has developed a technique that uses the power flux observations obtained during a single pass of the satellite over a polar region (which takes about 25 minutes) to estimate the total power deposited in an entire polar region by these auroral particles. The power input estimate is converted to an auroral activity index that ranges from 1 to 10.
Credits:
Space Weather Images and Information (excluded from copyright) courtesy of: NOAA / NWS Space Weather Prediction Center, Mauna Loa Solar Observatory (HAO/NCAR), and SOHO (ESA & NASA).Space Weather links:
3-Day Forecast of Solar and Geophysical Activity
Space Weather Now
Real-Time Solar Wind
Solar and Heliospheric Observatory (SOHO)
The Very Latest SOHO Images